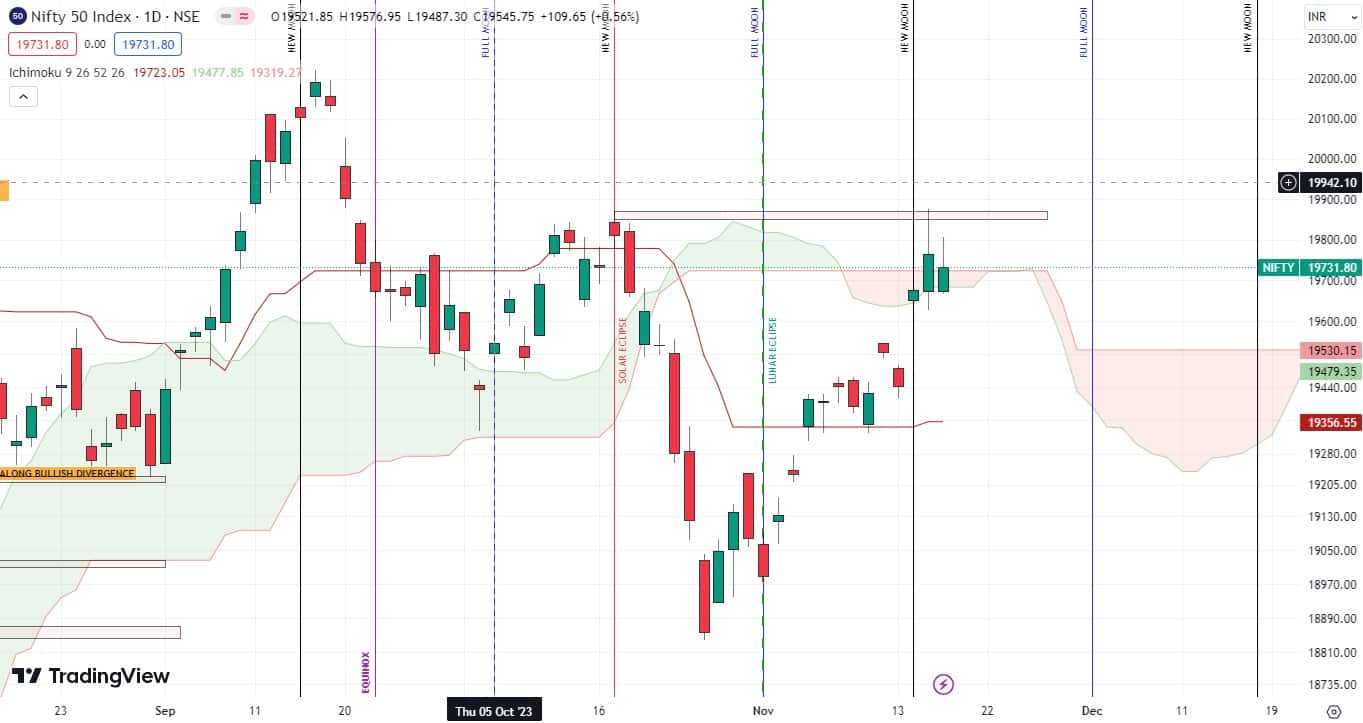
"On a daily scale, price action is stalling exactly near Ichimoku cloud resistance, while the future cloud is still bearish and the base line is still flat, which might call for a correction," says Jigar S Patel, senior manager for equity research at Anand Rathi.
During an interview with Moneycontrol, Patel says that Bank Nifty may break the October low in the next one or two months. And, he is bullish on the IT space. "Most probably, the Nifty IT index will take out September high soon. Since April 2023, Nifty IT has been making higher highs and higher lows on a regular basis, which is a sign of strength," says the seasoned technical analyst.
Excerpts from the interview:
Why do you think the market will fall below 200-day exponential moving average (EMA) of 18,910 before taking a big leap towards a record high?
Since we have seen a massive V-shape recovery of 1,038 points after hitting the low of 18,837, on a daily scale, price action is stalling exactly near Ichimoku cloud resistance, while the future cloud is still bearish and the base line is still flat, which might call for a correction.
Even during the 1038-point recovery, FIIs were continuously selling in the cash market. These are the major reasons why we expect a correction in the Nifty.
Considering the weakness in the Bank Nifty, do you think the index will break October lows?
Yes, we do think that Bank Nifty might break the October low in the coming one or two months, as it has already reversed from its previous swing high of 44,800, approximately, and possibly can make another round of lower lows.
On the indicator front, daily DMI's (directional movement index) have turned bearish, along with the daily RSI (relative strength index) having reversed from the 60-65 zone.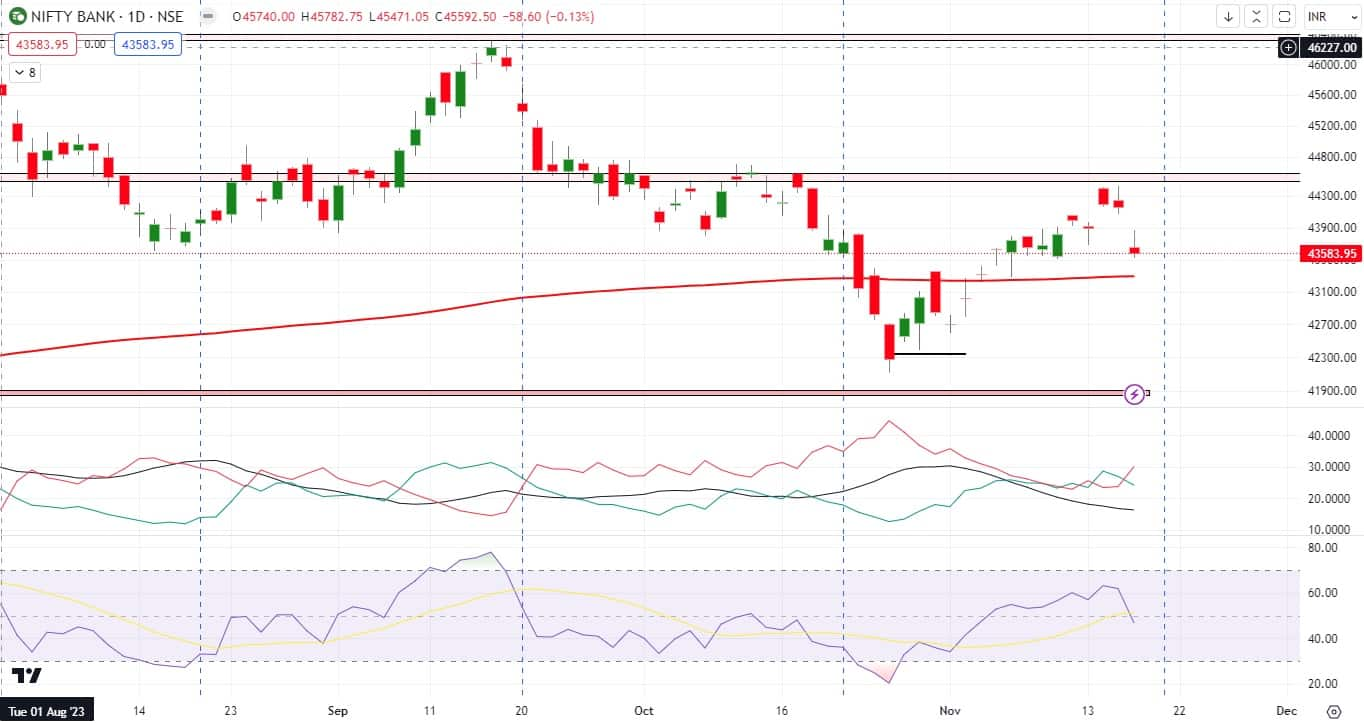
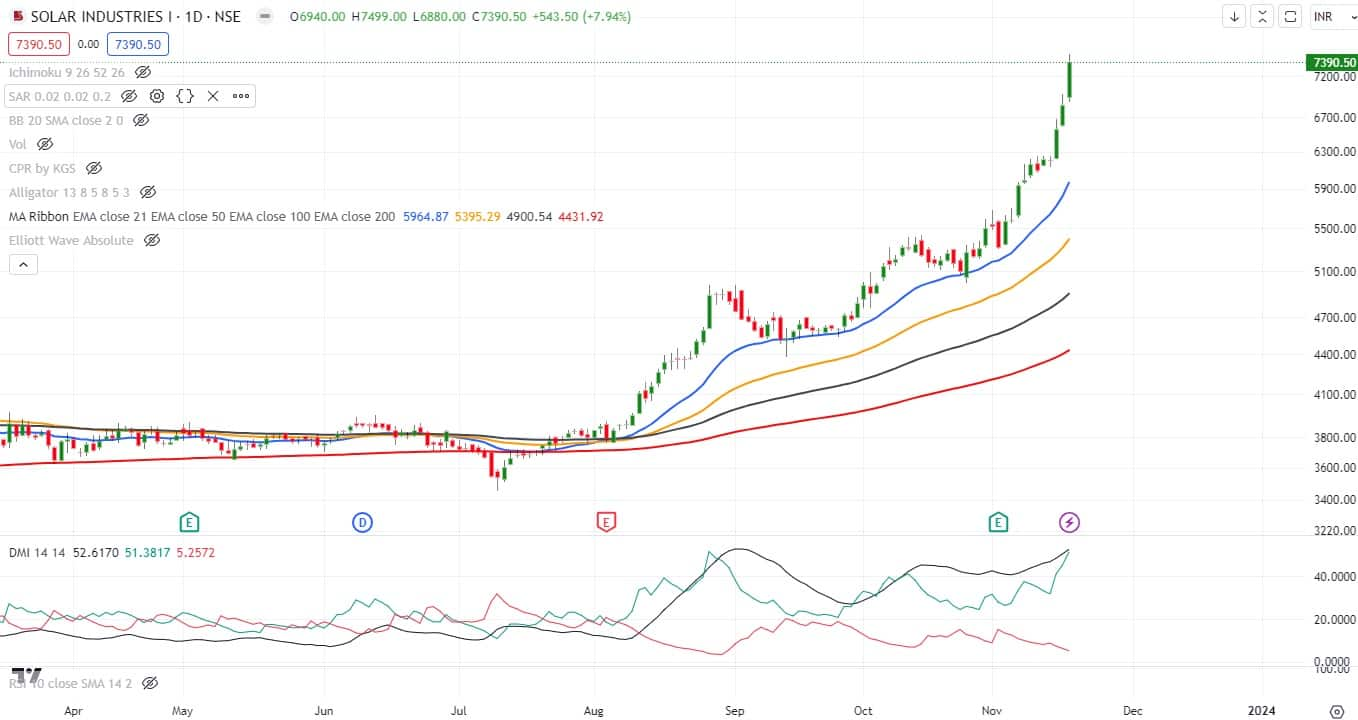
Is the Solar Industries looking overbought now after consistently for last three weeks?
Solar Industries is looking overbought now as it is trading way above all major daily exponential averages, so a reversion to mean can be possible in the form of profit-booking.
On the indicator front, daily DMIs look exhausted since the ADX (average directional index) line is placed above both DMIs, which might call for some cooling in the coming few weeks. One can refrain from adding fresh longs and quickly book partial profits in the zone of Rs 7,300–7,500.
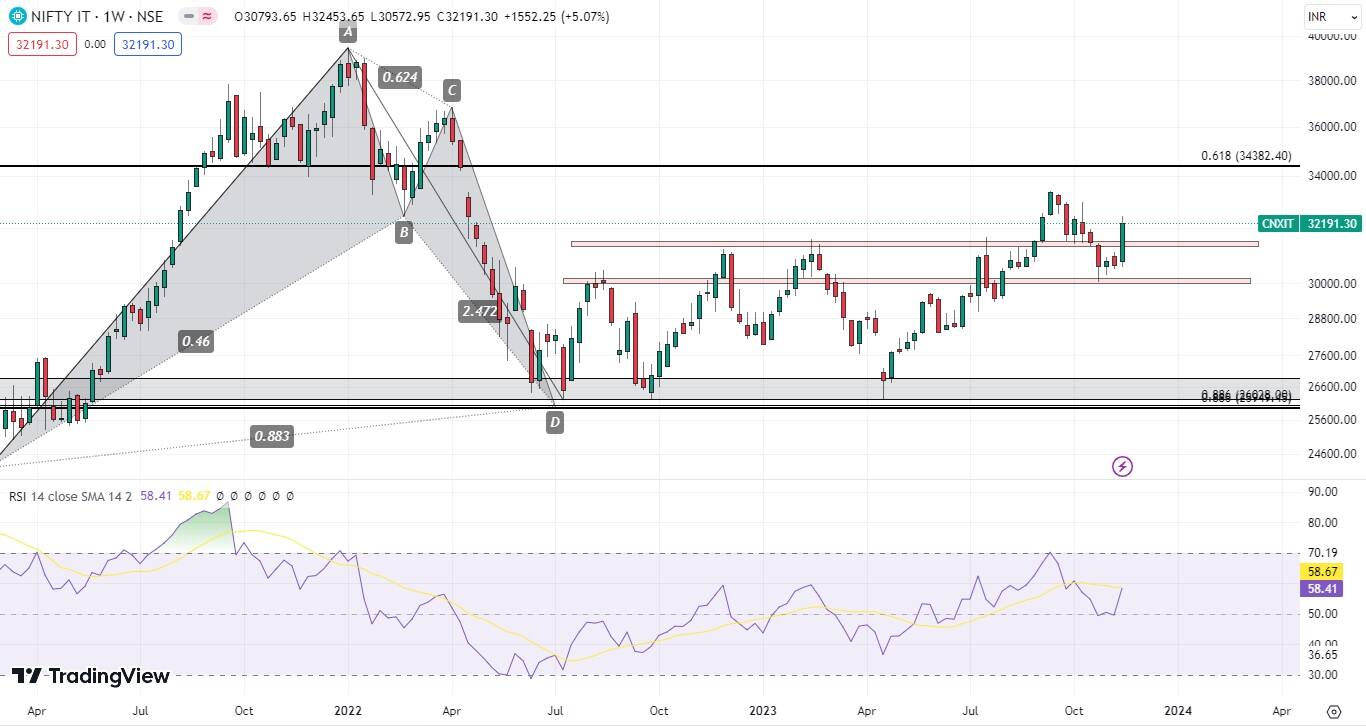
Do you expect the Nifty IT to surpass its September high, soon?
Most probably, it will take out September high soon. Since April 2023, Nifty IT has been making higher highs and higher lows on a regular basis, which is a sign of strength.
Heavyweights like TCS and Infosys will contribute to Nifty IT since it looks lucrative at current levels. Recently, price action has reversed firmly on a weekly scale, with a big green candle exactly from its credible support of 30,000. Also, RSI Weekly has reversed from 50 levels, further adding to the bullish bias.
Do you think the time cycle theory is the best to predict the market direction? What is the unique in time cycle compared to other theories?
When time and price tools are used together, they give very precise indications of possible future price action.
Here are some of the unique ways to use time tools:
--Measuring time between market pivot points (in terms of days, weeks, or years) and then matching with Fibonacci numbers
--Plotting the season change date on the daily chart
20–21 March of every year
21–22 June of every year
22–23 September of every year
21–22 December of every year
Considering the V-shape recovery, do you expect another leg of strong run in Larsen & Toubro?
Larsen & Toubro has been a very consistent performer. The recovery, which looks like a V-shape, is just the continuation of its major uptrend. Yes, we expect another leg of a strong run in L&T since price action is continuously backed by the Monthly Central Pivot range (black dots on the chart) in the form of support, along with RSI and DMI's hinting towards a bullish stance.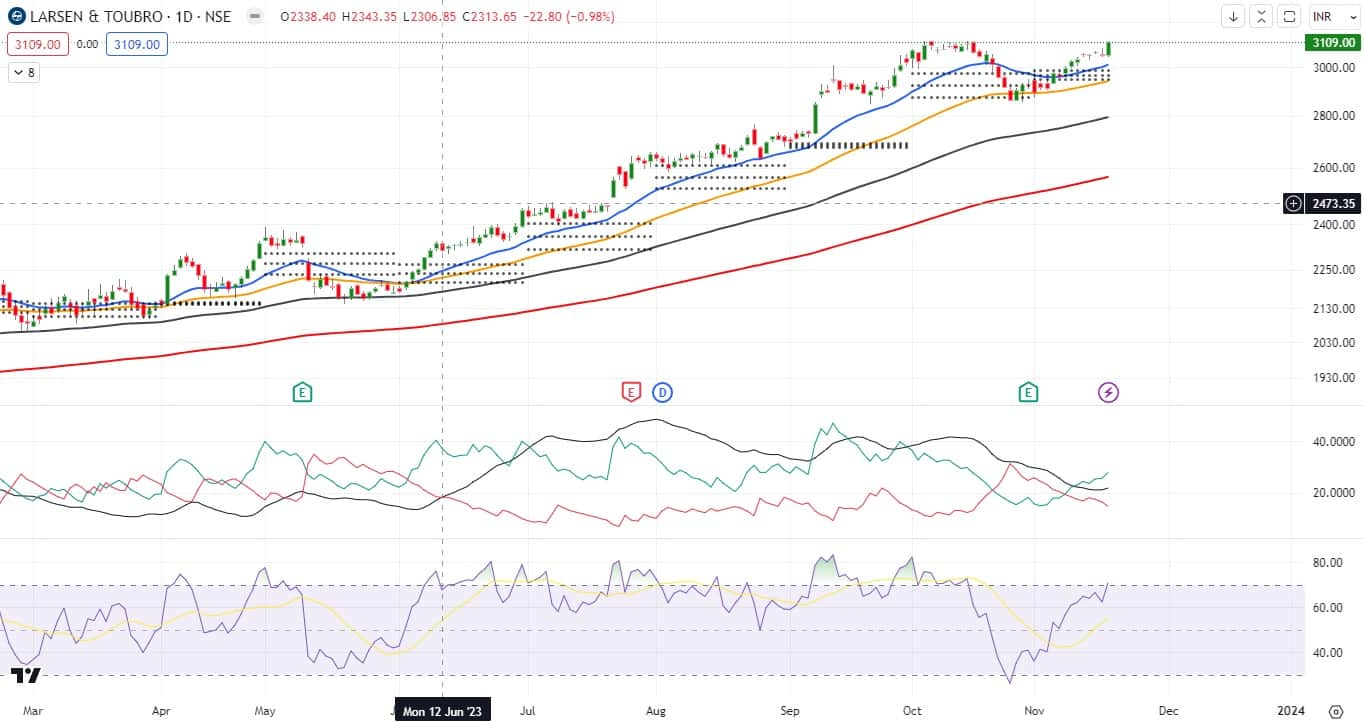
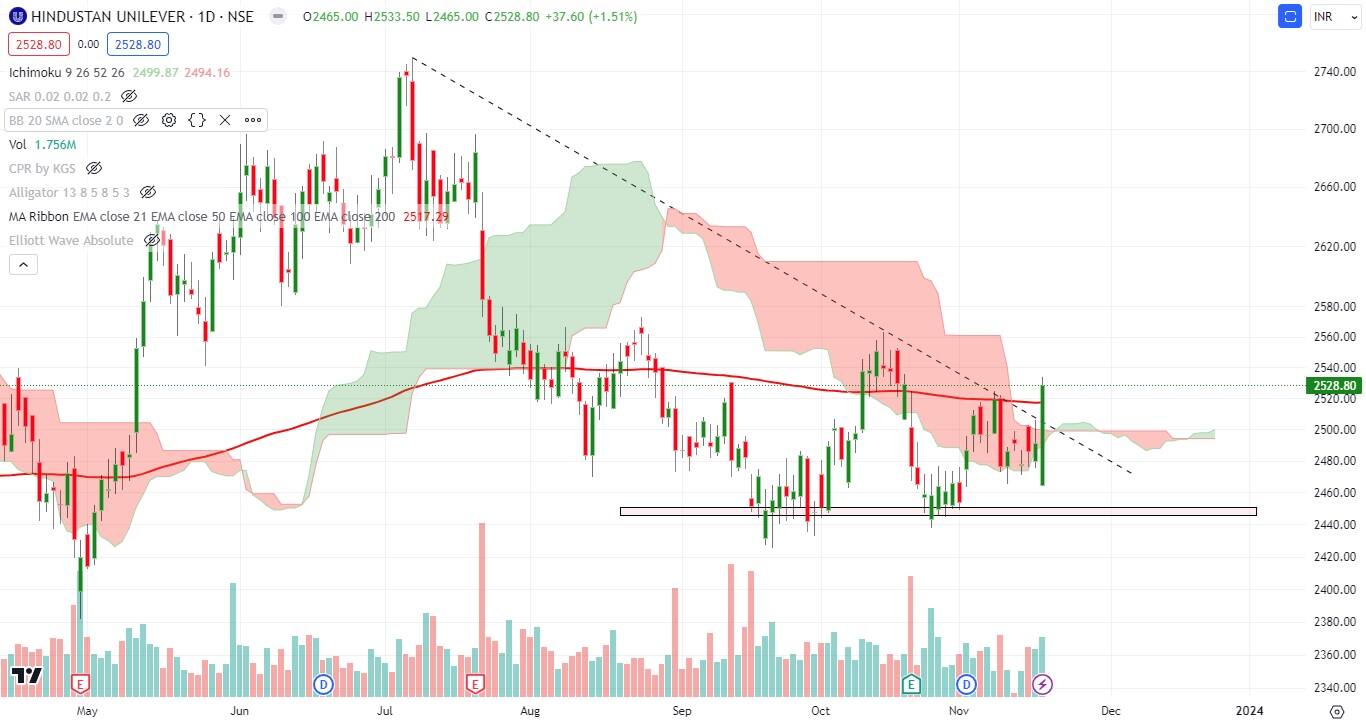
Do you think HUL seems to be ready for up move in coming weeks, after looking at the charts?
Hindustan Unilever (HUL) has a solid base near Rs 2,420–2,460 zone, which is also its historical support. On a daily scale, the Ichimoku cloud has been taken out, and the future cloud has turned bullish.
Also, bearish trendline violations (refer to the chart) are seen along with decent volume, which further hints towards a bullish stance in HUL. As we advance, one can expect Rs 2,650 in the coming few weeks.
Disclaimer: The views and investment tips expressed by investment experts on Moneycontrol.com are their own and not those of the website or its management. Moneycontrol.com advises users to check with certified experts before taking any investment decisions.
Discover the latest business news, Sensex, and Nifty updates. Obtain Personal Finance insights, tax queries, and expert opinions on Moneycontrol or download the Moneycontrol App to stay updated!